You are here
Climate change and sea-level rise based on observed data
Temperature and sea levels have risen across Australia since regular observations began in the early 20th century.
At a glance
-
The global land and sea temperature record shows that temperatures have risen by about 1.0oC since 1850.
- Since 1901, global mean sea level has risen by about 19 cm.
- In Australia, trends in temperature and sea level broadly follow those at a global scale. Seven of the ten warmest years on record since 1910 have occurred since 2005.
Main text
Climate changes on all timescales, from short-term fluctuations such as El Niño events through to glacial-interglacial fluctuations that last many thousands of years. Emissions of greenhouse gases from human activities are just one cause of climate change. We call this cause of climate change global warming, or the enhanced greenhouse effect. Both can be used: some people say that ‘global warming’ is incorrect, because the warming is not the same everywhere – some places are warming more than others, and there is even an area of the North Atlantic that is cooling. But in fact both terms are widely accepted.
Global warming has affected our climate since the beginning of the Industrial Revolution in the Northern Hemisphere, or about 1750 (for an explanation of how global warming works, see Causes of climate change).
To understand weather and climate fluctuation in time and space, we need reliable and consistent records—these are measurements at the same time of day taken by the same instruments. This standardisation took place gradually through the nineteenth century, with widespread adoption of the Stevenson screen from the 1880s, and the Symonds rain gauge from the 1890s. More recently, we have evidence from satellites, starting in 1978 with temperature data. Box 1 gives a brief introduction to the history of meteorological observations in Australia.
Box 1: Meteorological observations in Australia.
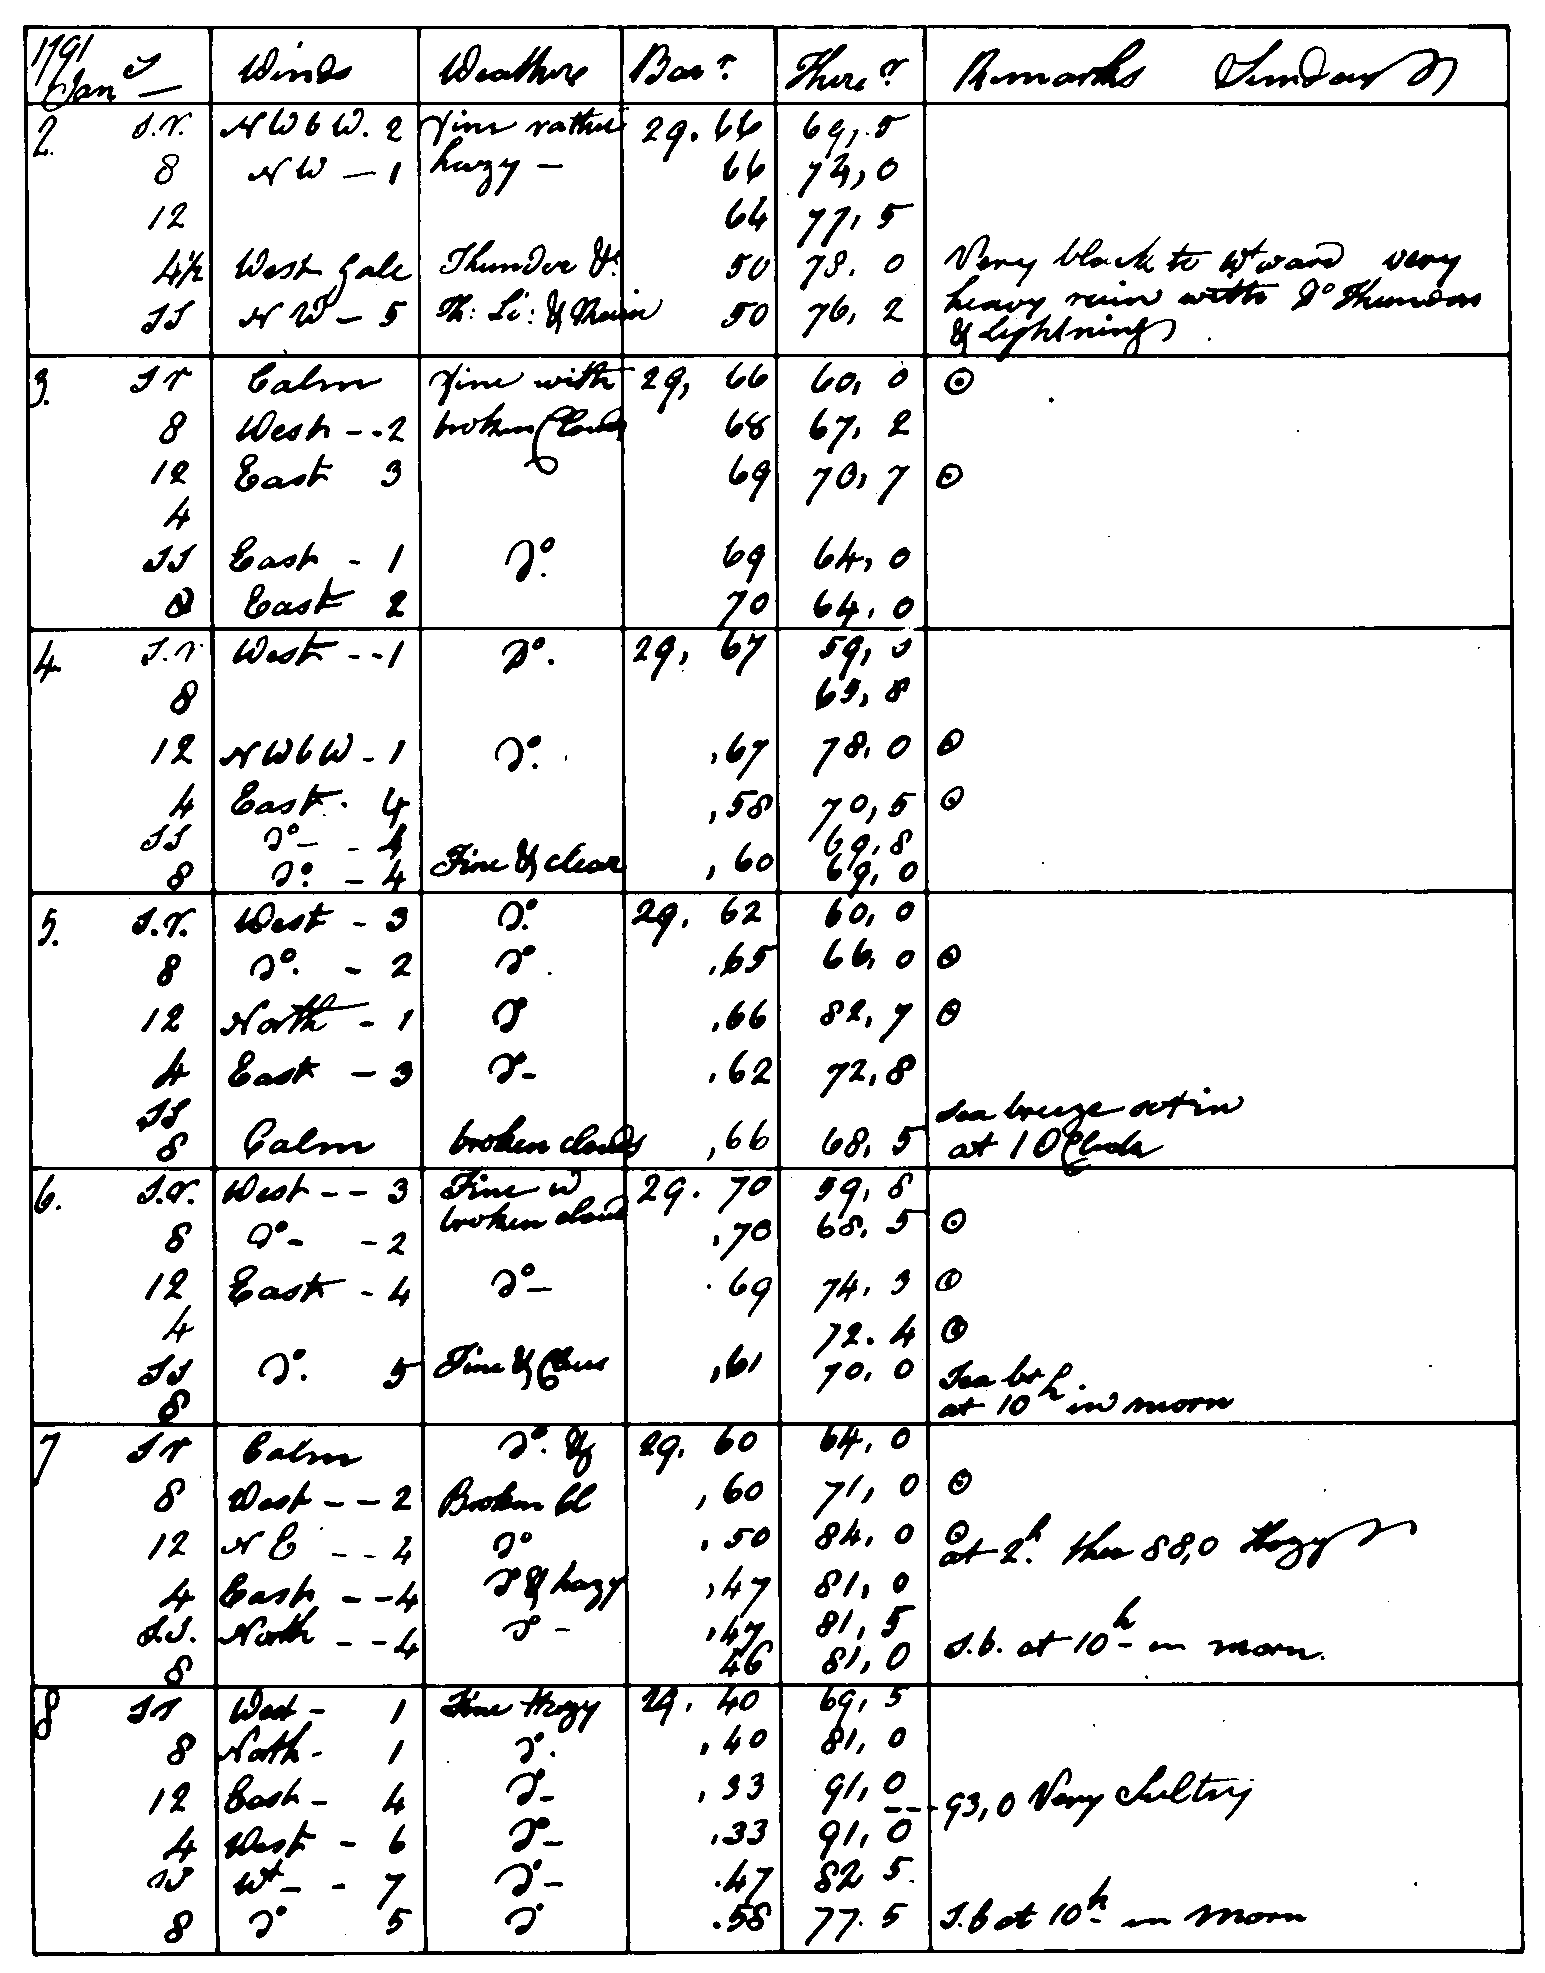
Formal measurement of the weather using meteorological instruments began within months of the arrival of the First Fleet in 1788, when Lieutenant William Dawes set up an astronomical observatory (Figure B.1) and commenced recording weather observations. Dawes’ recordings are held by the Royal Society in London (see Figure B.2).
For a very long time there was no common standard for observing equipment, but by 1910 the newly-formed Australian Bureau of Meteorology had established standardised equipment across much of the country.
Up to 2007, the highest temperature record for Australia was 53.1oC, recorded at Cloncurry on 16 January, 1889. However, because this was measured by a thermometer located in a beer crate, the record was set aside in 2007, and replaced by a new record of 50.7oC, measured on 3 January, 1960 in a Stevenson screen located at Oodnadatta in South Australia.
In 2011, the Bureau had 774 temperature recording sites and nearly 6000 rain gauges operating across Australia.
Sources of information: http://www.bom.gov.au/climate/change/acorn-sat/, https://www.theage.com.au/articles/2004/01/21/1074360834960.html (both accessed 24 May 2016).
T1I2_Figure-B1.gif
T1I2_Figure B2.png
Worldwide changes
Temperature
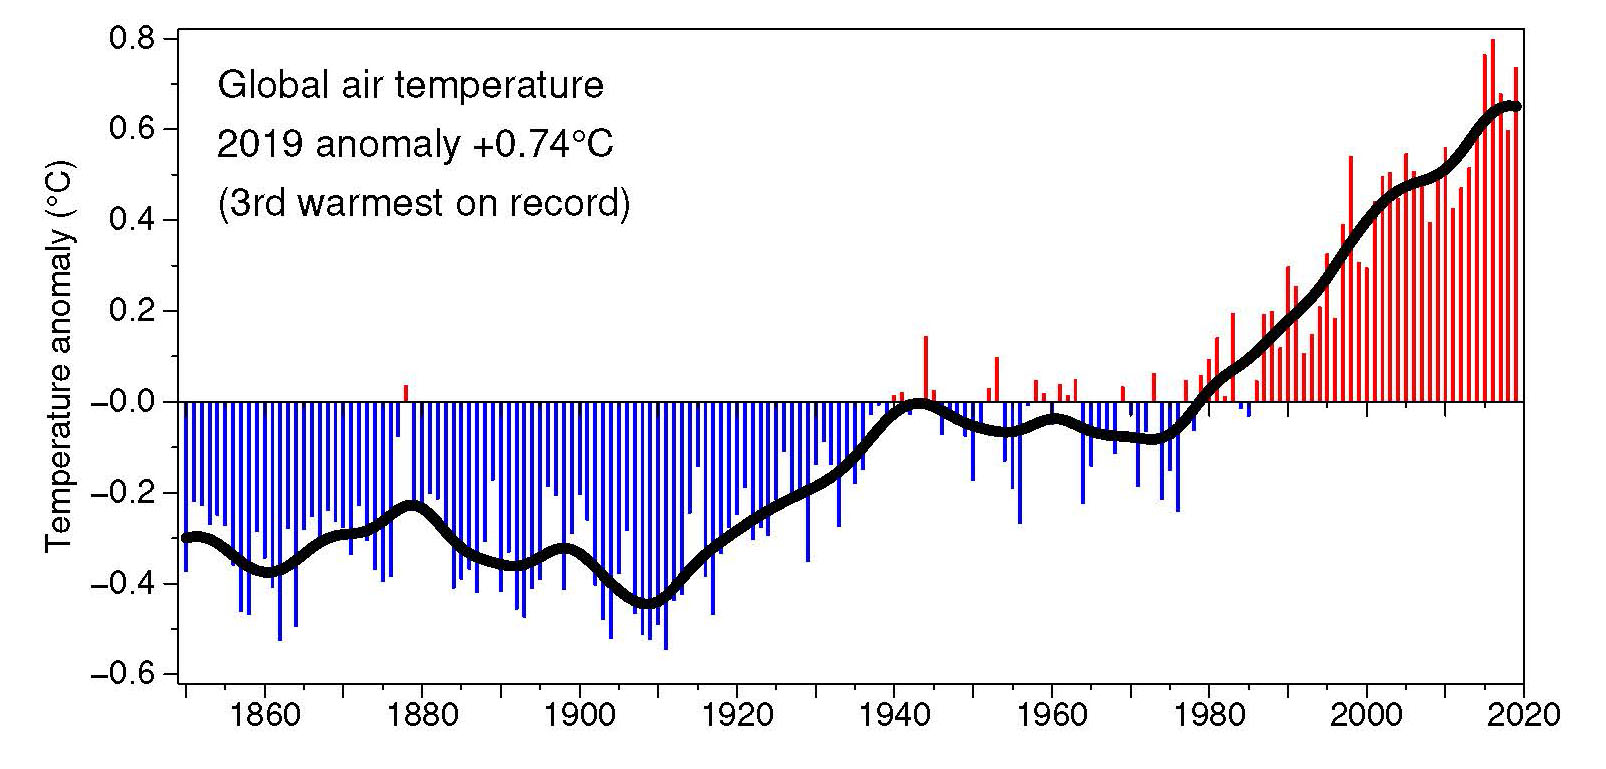
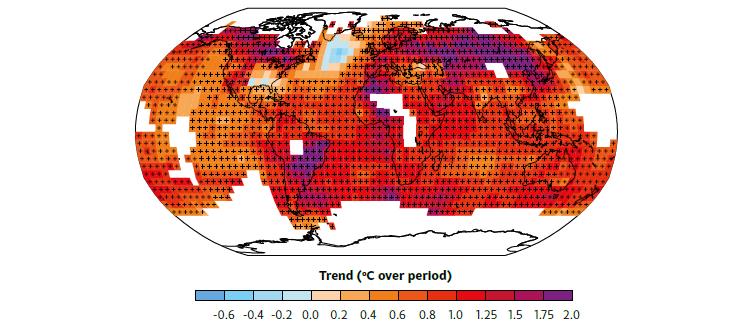
Observations from around the world, including satellite observations, can be used to understand how global warming is affecting temperatures. Figure 1 shows the global long-term trend, constructed by averaging from all records over the land and sea (sea surface temperatures are measured by ships and, more recently, by satellite). The temperature has risen by about 1oC since the start of the record in 1850. Figure 2 shows the spatial patterns of this warming. Despite widespread warming throughout the 20th and 21st centuries, there is still one area of the world that is unaffected, in the NW Atlantic.
Global_Temperature_Change.jpg
T1I2_Figure 2.jpg
Animation: Global warming from 1880 to 2017: http://climate.nasa.gov/climate_resources/139/ (accessed 12 March 2018). Source: NASA/Goddard Space Flight Centre Scientific Visualization Studio. Data provided by Robert B. Schmunk (NASA/GSFC GISS).
Global rainfall patterns
Rainfall is highly variable in time and in space, and so it is difficult to identify long-term trends in the midst of all the background noise caused by natural variability. One of the major drivers of rainfall variability at the global scale is ENSO, the El Niño Southern Oscillation (see Australia's current climate). On average, the world is getting more precipitation (rainfall plus snow) now than it did 100 years ago, although in some regions the trend has been toward decrease. Global trends are shown in Figure 3.
T1I2_Figure-3.gif
Extreme events
Working out whether the occurrence of extreme events has changed over time is not straightforward. These events, by definition, occur only rarely, and therefore the sample size for analysis is small making it difficult to (i) identify trends and (ii) (even more difficult) attribute them to global warming. We can say with some confidence that the frequency and duration of heat waves is increasing over some land areas, including Australia. Heavy rainfall events also seem to be happening more often, and with greater intensity over some land areas.
Sea-level changes
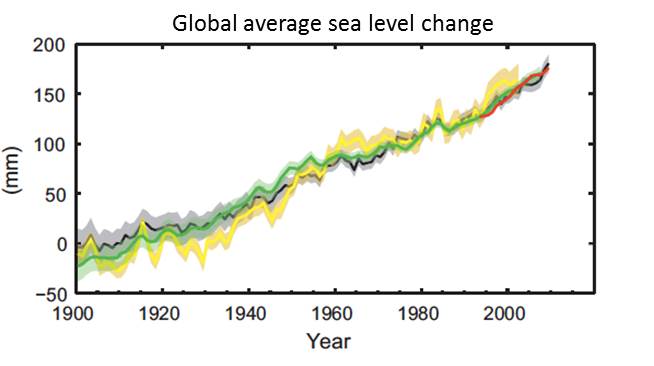
One of the outcomes from global warming is sea-level rise, caused by thermal expansion and melting of ice caps and glaciers. Since 1955, something like 90% of the excess heat produced by global warming has gone into the oceans, so thermal expansion is an important component of sea-level rise. Over the period 1901 to 2010, global mean sea level rose by around 0.19 m.
T1I2_Figure 4.jpg
Changes over Australia
The average surface temperature over Australia and the surrounding oceans have increased by around 1oC since the beginning of the 20th century (Figure 5 left-hand side). Seven of the ten warmest years on record have occurred since 2005. The warmest year in the record going back to 1910 is 2013. The most recent year in the record, 2016, was the fourth warmest. There are spatial differences, with some areas warming faster than others, (Figure 5 right-hand side) but nowhere has cooled.
Since the mid 1990s, there have substantial long-term changes in rainfall over the continent:
- a significant increase in wet season rainfall over NW Australia (Figure 6 left)
- a declining trend over southwest Australia (Figure 6 right)
- a 15% reduction in late autumn and early winter rainfall in southeast Australia (Figure 6 right).
Sea levels have risen around Australia since the beginning of the 20th century, with a faster rate (partly due to natural variability) since 1993. There are geographical variations, with higher sea-level rise observed in the north and rates similar to the global average observed in the south and east.
Figure_5a_5b.gif
Figure_6a_6b.gif
Acknowledgement
We thank the Bureau of Meteorology and CSIRO for permissions to reproduce Figures 5 and 6.
CSIRO Disclaimer: CSIRO does not guarantee that the material or information it has provided is complete or accurate or without flaw of any kind, or is wholly appropriate for your particular purposes and therefore disclaims all liability for any error, loss or other consequence which may arise directly or indirectly from you relying on any information or material it has provided (in part or in whole). Any reliance on the information or material CSIRO has provided is made at the reader's own risk.
Source material
Australian Academy of Science, 2015: The Science of Climate Change: Questions and Answers. Canberra. Accessed 29 May 2018. [Available online at https://www.science.org.au/learning/general-audience/science-booklets-0/science-climate-change/2-how-has-climate-changed].
Bureau of Meteorology and CSIRO, 2016: State of Climate 2016. Prepared by the Bureau of Meteorology and CSIRO. 23 pp. Accessed 6 February 2017. [Available online at http://www.bom.gov.au/state-of-the-climate/ and http://www.csiro.au/state-of-the-climate].
Hartmann, D.L., and Colleagues, 2013: Observations: Atmosphere and Surface. In: Climate Change 2013: The Physical Science Basis. Contribution of Working Group I to the Fifth Assessment Report of the Intergovernmental Panel on Climate Change, Stocker, T.F., D. Qin, G.-K. Plattner, M.Tignor, S.K. Allen, J. Boschung, A. Nauels, Y. Xia, V. Bex and P.M. Midgley, Eds., Cambridge University Press, Cambridge, United Kingdom and New York, NY, USA. Accessed 15 June 2016. [Available online at https://www.ipcc.ch/site/assets/uploads/2017/09/WG1AR5_Chapter02_FINAL.pdf].
IPCC, 2013: Summary for Policy Makers. In: Climate Change 2013: The Physical Science Basis. Contribution of Working Group I of the Fifth Assessment Report of the Intergovernmental Panel on Climate Change, Stocker, T.F., D. Qin, G.-K. Plattner, M.Tignor, S.K. Allen, J. Boschung, A. Nauels, Y. Xia, V. Bex and P.M. Midgley, Eds., Cambridge University Press, Cambridge, United Kingdom and New York, NY, USA. Accessed 24 May 2016 [Available online at https://www.ipcc.ch/site/assets/uploads/2018/02/WG1AR5_SPM_FINAL.pdf]
McAfee, R.J., 1978: William Dawes: Australias first 'meteorologist'. Australian Meteorological Magazine 26(3), 79-83. Accessed 24 May 2016. [Available online at http://www.bom.gov.au/jshess/docs/1978/mcafee.pdf].
Morice, C.P., J.J. Kennedy, N.A. Rayner, and P.D. Jones, 2012: Quantifying uncertainties in global and regional temperature change using an ensemble of observational estimates: the HadCRUT4 dataset. Journal of Geophysical Research: Atmospheres, 117(D8).