You are here
CoastAdapt datasets
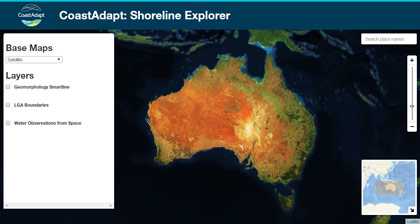 Access Shoreline Explorer
![]() Dataset Guidance 1
Dataset Guidance 1
Shoreline Explorer: present-day information
The Shoreline Explorer contains data for exploring the characteristics of the Australian coast at the present-day. These characteristics are a guide to the sensitivity and vulnerability of the coast to inundation and erosion now and in the future.
There are three datasets in Shoreline Explorer. There are brief introductions below. For more information, go to Dataset Guidance 1.
Sediment Compartments and their Characteristics
Scientists have divided the Australian coast into 359 discrete units, or sediment compartments, within which there are broadly homogeneous features that may include geology, landform types, near-shore currents and sediment availability and movement. A compartment might be, for example, a bay lying between two headlands. CoastAdapt provides descriptions and information for each sediment compartment around Australia. The compartment approach provides a spatial framework that integrates driving forces with landform type and condition to support and improve coastal risk assessments at regional scales under conditions of climate change.
Sediment Compartment information was developed in a research project funded by the Australian Government through the Department of the Environment and managed by NCCARF. The project was led by NCCARF and Bruce Thom and the participants were Colin Woodroffe, Andrew Short, Chris Sharples, Nick Harvey, Matt Eliot and Ian Eliot.
Smartline
Smartline was developed to provide a single, consistent map of coastal landforms for the entire Australian coast. The Smartline is a polyline representation of the geomorphic features located within 500m of the high water mark to landwards and seawards. The Smartline map divides the coastline into distinct segments; within each, multiple GIS attributes describe the dominant coastal landforms.
Smartline is provided in CoastAdapt at two resolutions:
- At the simplest level, a single map layer can be used to display the coast classified into just five landform categories based on very broad differences in the composition and erodibility of coastal landforms.
- At the second level of detail, separate layers can be displayed showing the location and extent of more differentiated but still quite broadly-defined coastal landform types or groups, such as hard rocky shores (of several types, e.g., cliffed and sloping), sandy beaches (e.g., backed by bedrock or by soft sediment terrain), soft-rock shores of several types, and others.
For more information, see http://www.ozcoasts.gov.au/coastal/introduction.jsp
NCCARF thanks Geoscience Australia for permission to reproduce Smartline.
Water Observation from Space (WOfS)
Water Observations from Space (WOfS) displays historical surface water observations derived from Landsat 5 and Landsat 7 satellite imagery for all of Australia from 1987 to 2014. WOfS allows better understanding of where water is usually present, where it is seldom observed and where inundation of the surface has been occasionally observed by satellite. For each grid cell within the map, WOfS displays:
- the percentage of clear observations on which water was detected from 1987 to 2014 (i.e. the number of occasions water was detected divided by the number of clear satellite observations);
- the confidence (or probability) that a water observation in this location is correct. This is a percentage, based on a number of factors including the slope of the land and the existence of other corroborative evidence.
For more information, see http://www.ga.gov.au/scientific-topics/hazards/flood/wofs/faqs
NCCARF thanks Geoscience Australia for permission to reproduce Water Observations from Space.
Sea-Level Rise and You: information about future risks
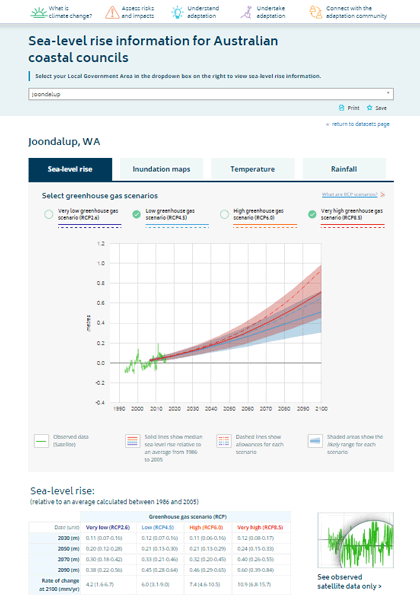 Access Sea-level Rise and You
![]() Summary guidance: Dataset Guidance 2
Summary guidance: Dataset Guidance 2![]() Detailed guidance on sea-level rise projections
Detailed guidance on sea-level rise projections![]() Detailed guidance on temperature and rainfall datasets
Detailed guidance on temperature and rainfall datasets
In its original version, Sea-Level Rise and You only contained information on future sea-level rise and associated inundation. We have now added information on climate (temperature and rainfall) extremes.
The datasets in Sea-Level Rise and You are for:
- every coastal local council in Australia
- the present-day through to 2100
- up to four greenhouse gas concentration scenarios (the Representative Concentration Pathways, or RCPs).
In Sea-level Rise and You, we have labelled the RCP scenarios:
| Very high: | RCP8.5 |
| High: | RCP6.0 |
| Low: | RCP4.5 |
| Very low: | RCP2.6 |
The terminology refers to the change in greenhouse gas concentration in the atmosphere, not the absolute amount.
All RCP scenarios show an increase in atmospheric greenhouse gas concentrations over the present day up to 2100 – whereas the increase for RCP8.5 (little attempt at mitigation) is very high, the increase for RCP2.6 (a strong mitigation scenario) is very low.
Future sea-level rise and its effects
For every coastal council in Australia, CoastAdapt provides graphs and tables on:
- mean sea-level rise, together with a confidence interval
- the allowance - the height that coastal defences would need to be raised in order to provide the same level of protection as they do today.
Information is provided for all four RCP scenarios, and from now to 2100. It takes into account both thermal and dynamic influences on sea level, including changes in ocean currents. It does not take into account changes in wave height or local land movements such as subsidence. The information is for the open coast - for closed bays or estuaries, additional changes may be possible.
CoastAdapt provides maps of:
- inundation extent. Inundation is defined here as the temporary flooding of a portion of land within the coastal zone.
The maps are for two RCP scenarios (8.5 and 4.5) and for two time slices: 2050 and 2100. Inundation is modelled using high-resolution digital elevation data and a simple 'bucket fill' approach. Initiating sea-level rise information is taken from Sea-level Rise and You. The result is approximate only: the model does not take account of existing sea walls, storm surge, erosion etc. The notional map resolution is 1:50,000.
If you wish to explore additional inundation scenarios (different time periods, sea-level rise scenarios etc.) a good resource is the Coastal Risk Australia website.
Information on methods and presentation, and how to use Sea-level Rise and You, is provided in Dataset Guidance 2.
Extremes of temperature and rainfall
For every coastal council in Australia, CoastAdapt provides graphs of future trends in:
- Hot days: Mean annual number of days with maximum temperature greater than 30 °C
- Warm nights: Mean annual number of days with minimum temperature greater than 25 °C
- Heatwaves: Average of longest run of days in each year with maximum temperature greater than 30 °C
- Very wet days: Mean annual number of days when rainfall exceeds the historic 99.9th percentile
- Dry conditions: Mean annual (May to Apr) number of months when total rainfall is less than the historic 10th percentile
Information on methods and presentation, and how to use Sea-level Rise and You, is provided in Dataset Guidance 2.
Accessing Sea-Level Rise and You
Clicking on the link above takes you to this page:
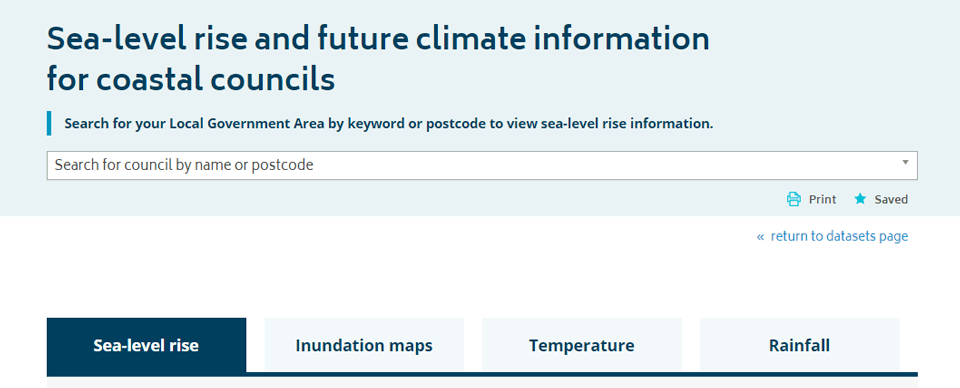
You can enter a council name or postcode in the top search box and then select one of the four tabs below (the default is sea-level rise) to see information for your chosen council.
Although Sea-level Rise and You is designed to be highly intuitive, we strongly advise you to read Dataset Guidance 2, which provides you with background to all the datasets and their use.
Acknowledgements
We are grateful to CSIRO for the provision of the sea-level rise and allowances data, in a project led by John Church and Kathy McInnes. A detailed technical Guidance Report is available. The temperature and rainfall extremes data were provided by CSIRO in a project led by John Clarke. Information on the derivation of these datasets is available here. The Collaborative Research Centre for Spatial Information provided the inundation mapping.